EM 12c, 13c: 'CPU Utilization (%) of a cpu' Metric Showing 'No data to display' On All Metrics In EM Console
Login to OEM Console -> Navigate to the Host target -> Monitoring -> All Metrics -> Expand "CPU Usage" -> Select "CPU Utilization (%) of a CPU" -> Select Last 24 Hours next to "View Data"
Last 24 hours' Graphs Data for the "CPU Utilization (%) of a CPU" metric of Host Target is Not Being Displayed in OEM Cloud Control.

'Usage Type' of 'Use of Metric Data' is setting "Alerting Only".
⇒This setting means, 'Upload Interval' of this metric is「On Alert].

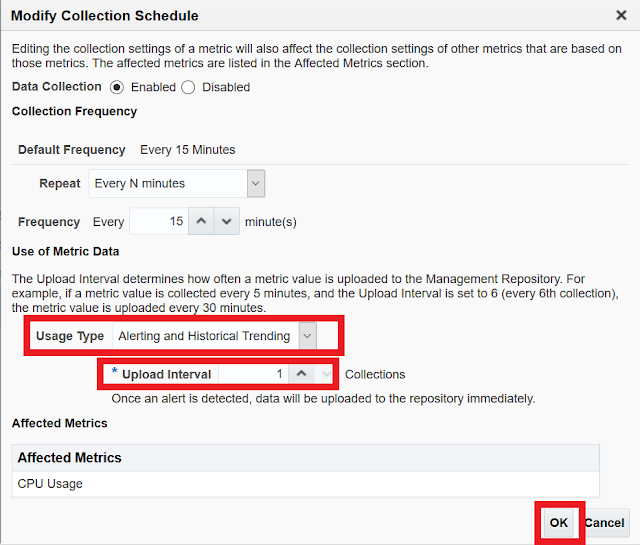
1) Change 'Usage Type' of 'Use of Metric Data' is setting from "Alerting Only" to "Alerting and Historical Trending".
2)'Upload Interval' setting a value except "0". ※The number must be greater than or equal to 1.
3) Click the "OK" button.
4) Wait for 15 minutes and verify the EM Console, it will show metrics data.
※It can be changed too, in the following in EM console.
Login to OEM Console -> Navigate to the Host target -> Monitoring -> Metric and Collection Settings -> Edit Collection Settings: <Metric_name>
Document ID - 2630530.1
No comments:
Post a Comment